Whizard 性能测试说明
对于 Whizard 的性能测试,通常可以从以下几个方面入手:
- 数据接收性能:测试 Whizard 在数据接受方面的性能表现,包括数据摄入速度、数据处理时间、数据存储性能等方面。
- 数据查询性能:测试 Whizard 在查询和分析数据方面的性能表现,包括查询响应时间、查询吞吐量、查询结果的准确性等方面。
- 可扩展性测试:测试 Whizard 在处理多租户数据时的性能表现,包括水平扩展性和租户管理等方面。
性能测试工具
Prometheus-benchmark allows testing data ingestion and querying performance for Prometheus-compatible systems on production-like workload.
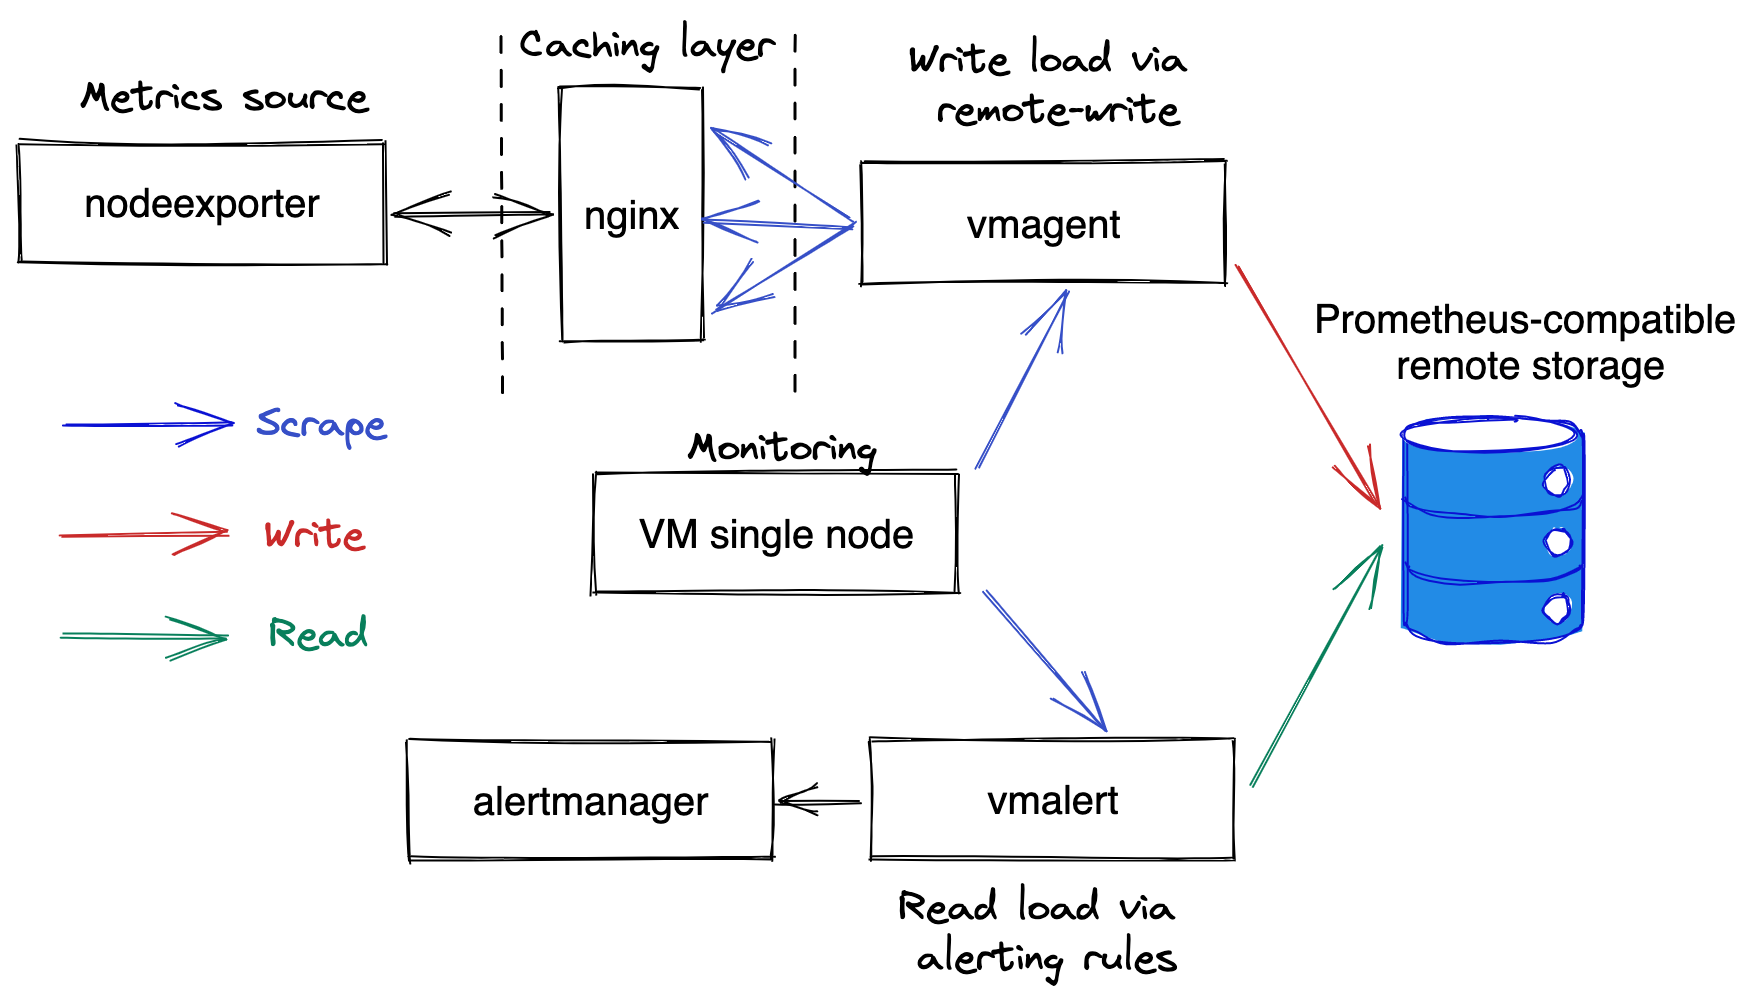
The prometheus-benchmark scrapes metrics from node_exporter and pushes the scraped metrics to the configured Prometheus-compatible remote storage systems. These systems must support Prometheus remote_write API for measuring data ingestion performance. Optionally these systems may support Prometheus querying API for measuring query performance.

The helm chart deploys the following pods:
vmagentwith the following containers:- nodeexporter - collects real metrics from Kubernetes node where it runs.
- nginx - caches responses from
nodeexporterfor 1 second in order to reduce load on it when scraping big number of targets. - vmagent-config-updater - generates config for target scraping. It is also responsible for generating time series churn rate via periodic updating of the generated targets.
- vmagent - scrapes
nodeexportermetrics vianginxfor targets generated byvmagent-config-updater.
vmalertwith the following containers:- vmalert - periodically executes alerting rules (aka read queries) against the testes remote storage.
- alertmanager - receives notifications from
vmalert. It is configured as a blackhole for the received notifications.vmalertpod is optional - it is used for generating read query load.
vmsingle- this pod runs a single-node VictoriaMetrics, which collects metrics fromvmagentandvmalertpods, so they could be analyzed during benchmark execution.
性能测试关键指标描述
- Data ingestion rate
- 99th percentile for the duration to execute queries
- 99th percentile for the duration to push the collected data to the configured remote storage systems
性能测试报告
当前版本:
历史版本: